
Economy
Air Pollution – Almost No-one Is Safe!
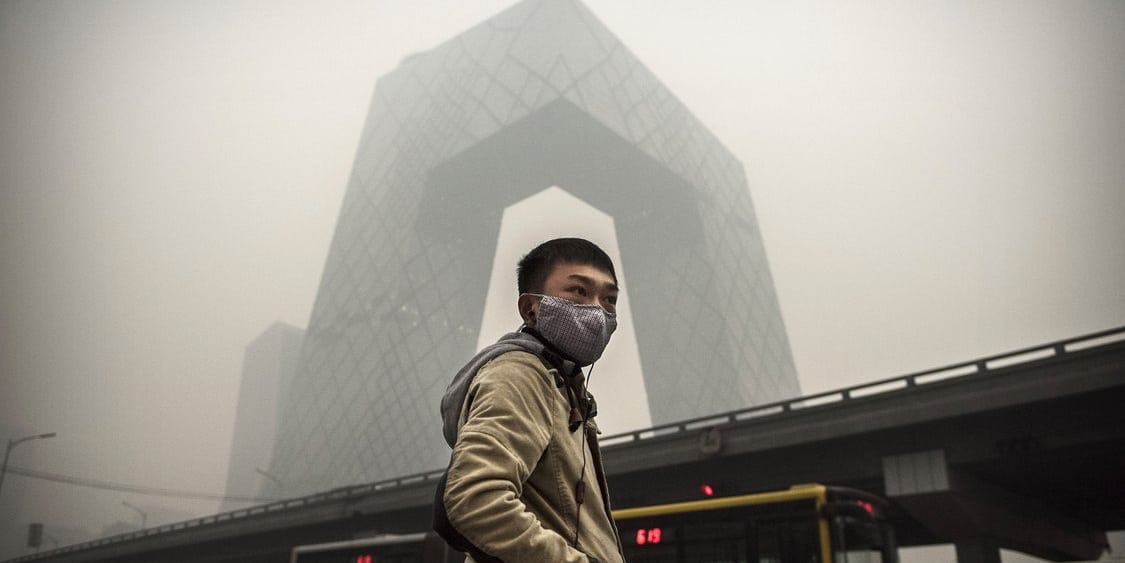
Air pollution is a frequently discussed topic worldwide – of course there are many elements which contribute to pollution overall, such as contaminated water, but unsurprisingly air pollution has the most serious impact on health standards of a large percentage of the world’s population, as it can be seen, tasted, as well as felt detrimentally in breathing. Reduced life expectancy – as low as 40 years in some countries – testifies to the seriousness of the situation blamed on air pollution. Watching or listening to news bulletins these days gives the impression that China – in particular Beijing and Shanghai – has the most serious air pollution problem, perhaps understandable given the large population, increasing urbanisation, accelerating industrialisation in recent years, and significant continuing reliance on fossil fuels. However, statistics are only as good as availability of data allows, so there are several regions and cities suspected as having far more serious problems in terms of air quality levels – reliable data is virtually non-existent for the African continent, with only 16 cities supplying reliable information.
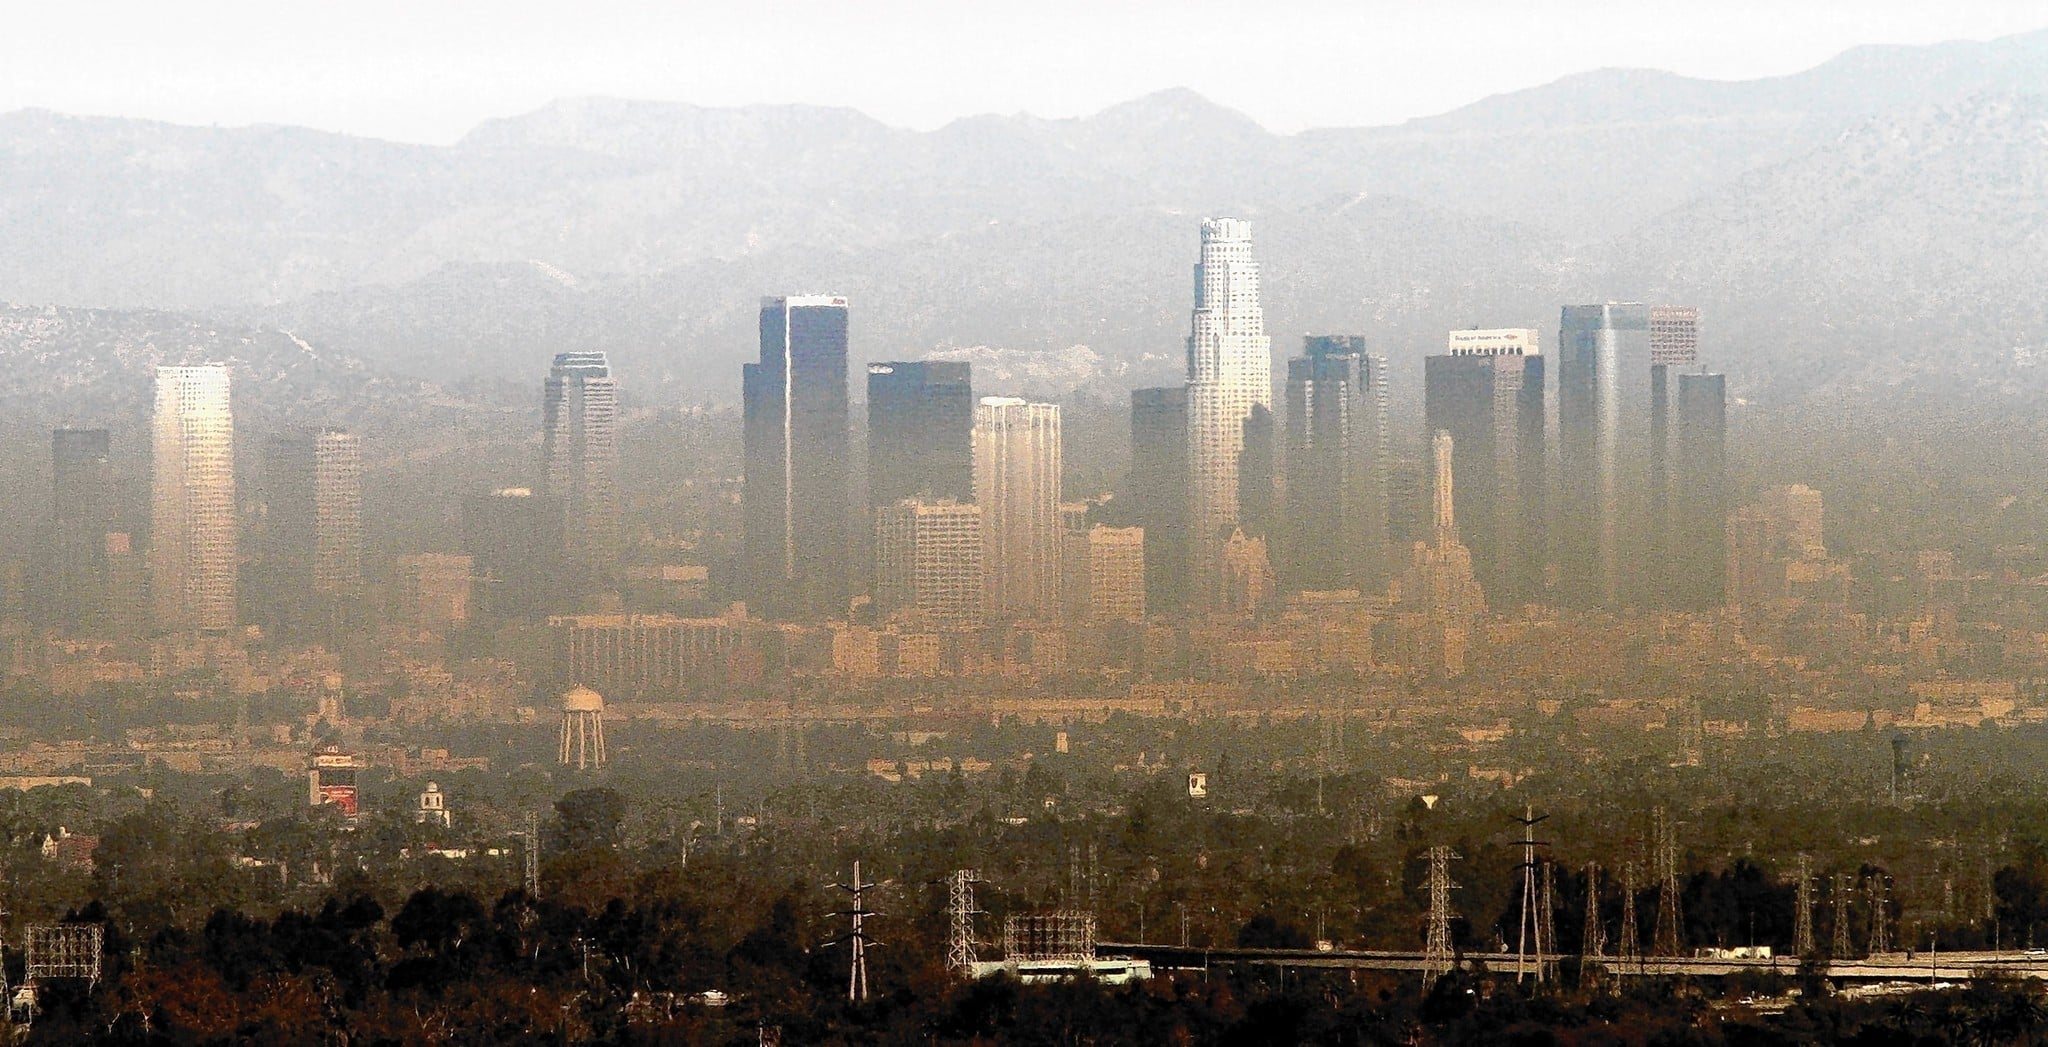
The worst areas for air pollution are actually the Indian sub-continent and the Middle East, but there is no place for complacency around the world in general. The World Health Organisation(WHO) database now covers 3000 cities in 103 countries – of cities with over 100,000 people in low- and middle-income countries, WHO air quality guidelines are NOT met in 98% of them; even in higher income countries, the figure is 56%. Overall, this means that from available data, over 80% of people worldwide live in urban areas, and have air quality readings exceeding WHO limits.
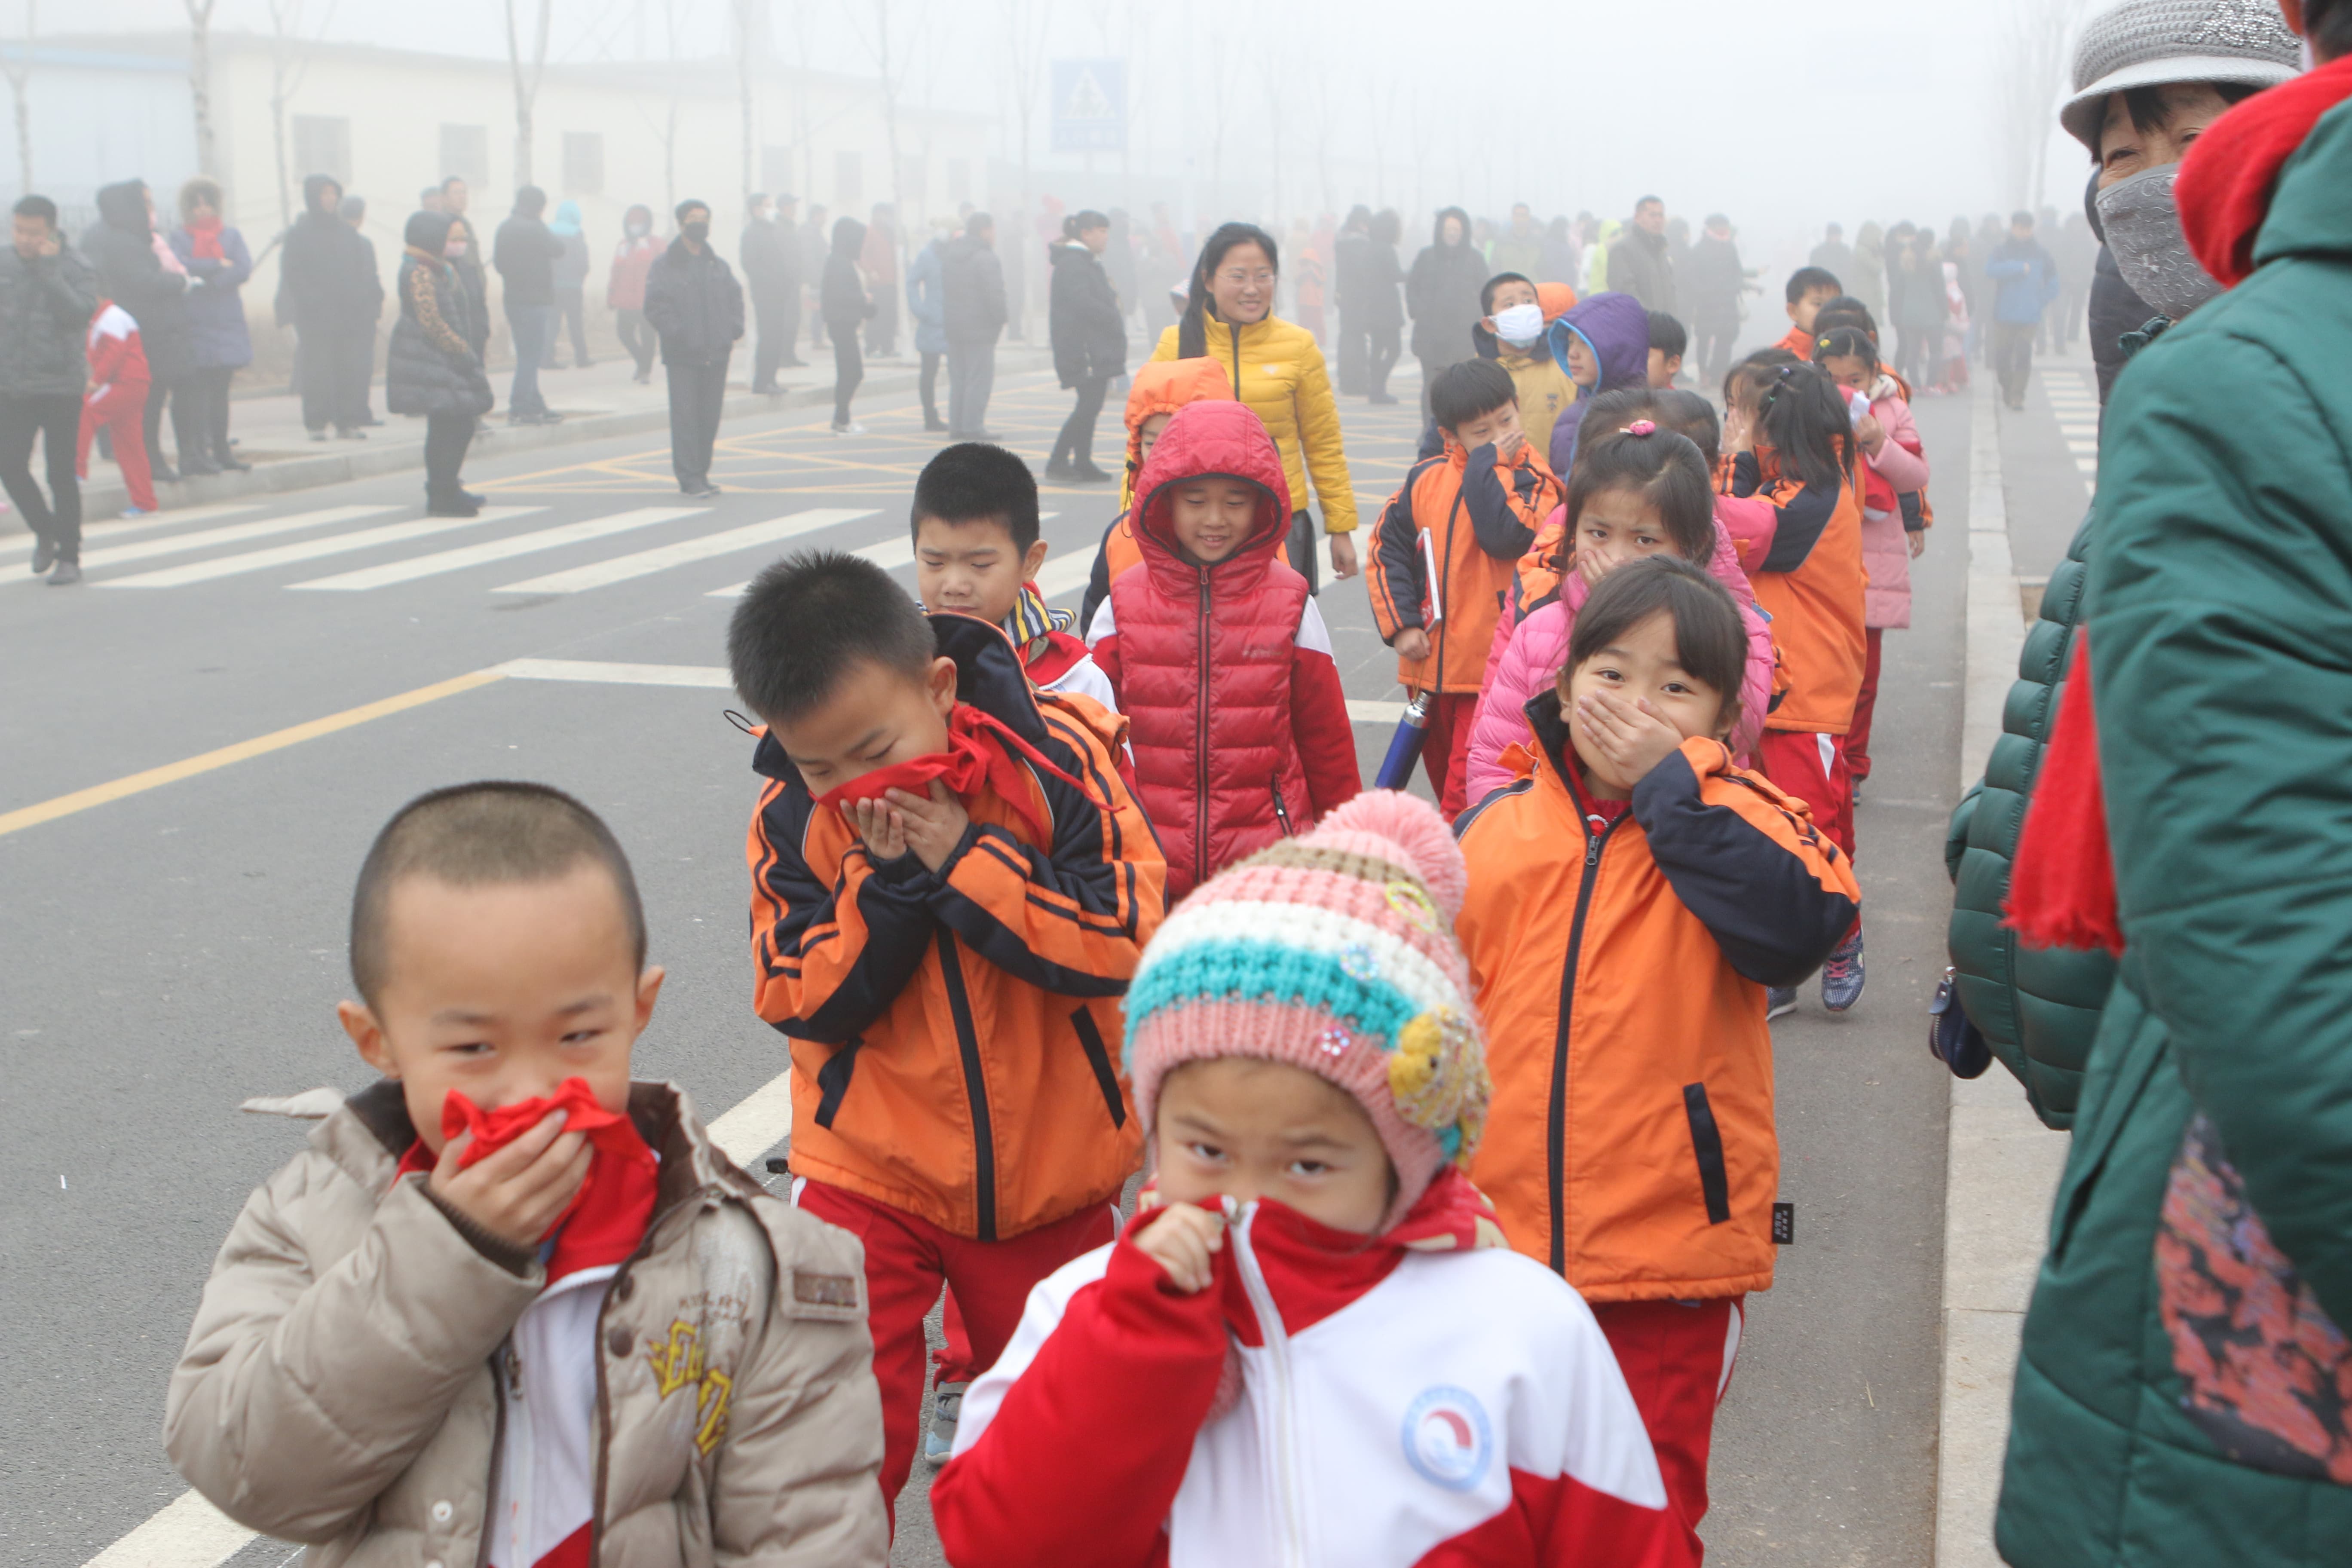
Although deaths are not recorded as being (directly) from air pollution, authorities around the world now accept that the declining quality of urban air in particular increases the risk of death from acute respiratory diseases, lung cancer, heart disease and stroke for the people who live in these areas, with a consequent and potentially unsustainable increase in the costs of health care. WHO estimates are that seven million deaths per year occur prematurely due to air pollution, three million because of the quality of outdoor air. What authorities do about it is another problem!
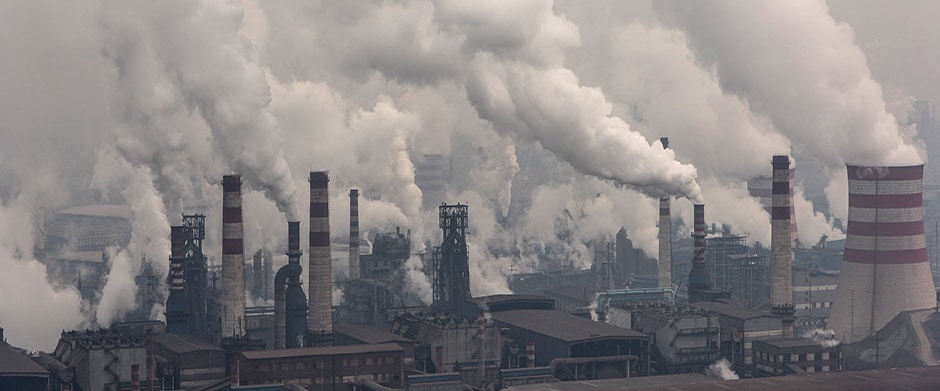
The Indian sub-continent has a problem similar to that of China, but Iran and other countries of the area are beset by the problem of sand- and dust-storms, which are very difficult to alleviate of course. Such an influence can vary significantly, but then burning the amount of coal for heating varies too, according to season, and the depressing fact is that more fossil fuel will be used in the worst effected areas as they transit through a period of major industrialisation before developing re-usable energy sources, similar to the process already passed by most first-world, developed areas.
Air quality is measured by the concentration of particulate matter – PM2.5 meaning particles smaller than 2.5 micrometres; a concentration of over 10 is considered by the WHO to pose a risk.
Zabol in Iran has recorded the most consistently dirty air, at a PM2.5 measure of 217 largely from dust storms. Following are the Indian cities of Delhi, Gwalior and Allahabad, then Riyadh and Al Jubail in Saudi Arabia. Many more cities in these two areas are at the top of the list, however, limited data from Lagos in Nigeria suggests that this city is in just as much discomfort from air pollution as those previously listed. Similarly, Ulan Bator in Mongolia is located in a natural bowl which retains polluted air above the city, including from burning fossil fuel.
Notable problem cities outside the areas defined above, which also includes southern Turkey, are identified in the following table for air pollution, although by no means as serious as those; secondly, all cities for overall pollution. The third table is of selected major cities, and the fourth the assessed cleanest urban areas in the world.
Air Pollution
| City | PM 2.5 level |
|---|---|
| Mauritius | 66 |
| Urumqi, China | 61 |
| Nanjing, China | 52 |
| Johannesburg, South Africa | 51 |
| Kathmandu, Nepal | 50 |
| Accra, Ghana | 49 |
| Baguio, Philippines | 49 |
| Temuco, Chile | 48 |
| Nis, Serbia | 45 |
| Fresno, USA | 45 |
Other Major Cities
| City | PM 2.5 level |
|---|---|
| Hanoi | 39 |
| Lima | 38 |
| Rio de Janeiro | 36 |
| Venice | 30 |
| Bangkok | 20 |
| Frankfurt | 19 |
| Singapore | 17 |
| Paris | 17 |
| London | 16 |
| New York | 14 |
General Pollution
| Rank | City | Contaminant |
|---|---|---|
| 1 | Linfen, China | Coal |
| 2 | Tianying, China | Lead, heavy metals |
| 3 | Sukinda, India | Hexavelent (steel) |
| 4 | Vapi, India | Chemicals, metals |
| 5 | La Oroya, Peru | Lead, copper, zinc, sulphur |
| 6 | Dzerzhinsk, Russia | Chemicals |
| 7 | Norilsk, Russia | Sulphur dioxide |
| 8 | Chernobyl, Ukraine | Radiation |
| 9 | Sumgayit, Azerbaijan | Chemicals, heavy metals, oil |
| 10 | Kabwe, Zambia | Cadmium, lead |
Cleanest Cities
| Rank | City | Contaminant |
|---|---|---|
| 1 | Calgary, Canada | excellent public transport; efficient garbage processing system |
| 2 | Honolulu, USA | light manufacturing; efficient public transport system |
| 3 | Helsinki, Finland | cheap, efficient public transport, wide streets= little congestion |
| 4 | Ottawa, Canada | efficient public transport, public city-cleaning projects |
| 5 | Minneapolis, USA | light rail, extensive bike lane system |
| 6 | Oslo, Norway | pro-active greening of the city, bus fuel from human wast |
| 7 | Stockholm, Sweden | significant percentage of ‘clean’ vehicles, only light and service industries |
| 8 | Zurich, Switzerland | mass transit options: buses, boats, light rail/street-cars |
| 9 | Katsuyama, Japan | tourist centre promoting cleanliness as a priority |
| 10 | Bern, Switzerland | cleanliness promoted to attract returning tourists |
Purchasing the stock exchange is mind-boggling for lots of individuals. Comprehending it looks like such a complex process which we leave it for the significant investors to fathom. However, are you aware the most successful stock traders live from the philosophies. Warren Buffett is really a known to maintain his investment principles quite fundamental, also it worked. Warren Buffett is really one of the very successful investors and among the richest guys on the planet. He likens it to the entire procedure for flipping a coin, “Heads, I win. Tails, I don’t drop a lot of.” This lets you know how seriously he takes Buffett’s theory within the diversification of investments. Based on Warren Buffett, diversification is really a protection against ignorance. Being a real Buffett disciple and following Buffett’s principles plus a few of their own sets of basic principles appeared to work. For individuals who don’t know, Mohnish Pabrai is an investor and philanthropist. Then a longonly equity fund he handled could create a cumulative 517% internet to investors versus. 43% for the S&P 500 Index since beginning in 2000. This implies an outperformance of 1103%. The globe was amazed and Pabrai became a star investor. Discover several hints and lessons as he shares how he was competent to do it.
Read Warren Buffett
According to Pabrai, it all started for him by reading Warren Buffett’s annual letters to investors and other Buffett books (The Essays of Warren Buffett, Warren Buffett Speaks and Thoughts of Chairman Buffett) and biographies written by Lowenstein and Schroeder. Pabrai is a living proof it pays to read.
Own It
Following closely Buffett’s example of not looking at stocks as just pieces of paper but internalize that you’re actual owners of these companies. As a joke surely no wise businessman will take his investments. Who wants a company that appears questionable and undervalued? He constantly weighs in both the negative risk and possible prior to making an investment.
Patience Is a Virtue
Another investor Pabrai seems as much as is Charlie Munger who’s a huge proponent of waiting. He believes that you’re able enough to earn money by means of purchasing or selling but within the waiting. And waiting isn’t the simplest thing to do this you demand every ounce of someone’s forbearance. Yes, sometimes what you’re looking forward to is some sort of disaster to occur that will significantly change the share prices. To stay positive about this would be to consider reaping something from the unfortunate circumstances which could present.
Learn from Mistakes
The fact is it doesn’t usually benefit the best constantly. You develop some, you lose some. Whenever you purchase shares, you must monitor carefully how it will. Pabrai says that after a particular trade doesn’t function, you discover immediately what might have went wrong so that you won’t do the same errors over and over. It is worth it to be aware of how others do it, if it’s right or wrong, in order to learn away from their successes and failures.
Checklist Investing
Another guiding light in Pabrai’s means to success is Atul Gawande’s novel The Checklist Manifesto. He recognized that there were clear signs within the initial location, when assessing how a trade went all wrong. So he made a check list which consists of around 98 questions he examines before making a trade or investment. These questions vary from leverage to debt covenants, moats, union and labor relations, direction and possession. Pabrai noted that since he incorporated using a checklist in investing, his error rate decreased quite considerably.
Cloning
Pabrai will be the first to inform you that not one of his investment ideas are original and groundbreaking. After all investing is actually not an originality competition. He picks on other people’s minds. The Buffet partnerships in the 1950’s was the design for the arrangement of his own fund. Furthermore, he gets investment ideas from investors he greatly admires. For example, he lifted the structure of his own fund straight from the Buffett partnerships of the 1950’s.
Give Back
Pabrai collectively with his wife began the Dakshana Foundation in 2005. It was the Pabrai’s intention to provide back to society at least two% of their earnings that’s about $1 million annually. Their primary focus was supposed to utilize the cash to help relieve the poverty within their state in India. How they are doing it is through supplying tutorial services for the lowest of poor students of India to ensure that they’ll have the ability to pass the grueling entrance examinations of the very competitive institutions such as the IIT Joint Entrance Examination and the AllIndia Engineering Entrance Examination, get great jobs and assist their loved ones. Again-all of Pabrai’s non-profit initiatives were inspired by Warren Buffet who’s a huge philanthropist himself.

So in terms of quality of life, just how rich are you? What is your real net worth, your wealth, and not simply in money? How hard do you have to work to satisfy your need for what you want out of life? Perhaps as important – how many years are you likely to live for, to enjoy your hard-earned riches?
Firstly, how is quality of life assessed, and secondly, how many hours a year do you need to work to earn this standard of living? A third – but immeasurable – factor could be priorities in what any person regards as important to his/her quality of life; perhaps you are happy to have little disposable income left after paying essential expenses, if it means working fewer hours but spending more time with family and friends. Or perhaps you are asset rich but time poor? For example, Americans are generally regarded as ‘rich’, but only five countries’ populations work longer hours, and the USA’s standard of living is only in the middle of the table. So maybe you will live a little longer, because you haven’t needed to work too hard.
Quality of Life Index is estimated by the OECD using a formula which includes purchasing power, health care, climate and safety indexes – the higher the better – and house price to income ratio, consumer price, pollution and traffic commute time indexes, the lower the better, all given weightings according to assumed importance.
Hours worked on average per year is the other side of the coin – a person may well have a relatively high income coupled with low or moderate expenses, but how much time is left for the person to enjoy his or her relative wealth? In the longer term, years of life expectancy depend on many factors, the most influential being diet and availability of medical care, except of course the negative effects of protracted conflict in which the country may be directly involved, perhaps partly borne out by Switzerland topping the list for quality of life – it managed to remain neutral during the two World Wars.
Efficiency would appear to be the key – that is, if the number of hours worked is relatively low, but quality of life is assessed as high, then in these times of increasing ‘free trade’ around the world, the country must be efficient otherwise it could not compete very well, with obvious consequences. This hypothesis may be born out by comparing the figures for Germany and Greece – the Germans would appear to justify their reputation for efficiency, and the Greeks for inefficiency, given that the latter spend 50% more time in working hours but manage to produce a score for quality of life 20% lower than the Germans. Only Mexico and South Korea of OECD countries work longer hours.
In the top 10 countries for quality of life, Denmark, The Netherlands and Norway also score well, and further down the table, French workers spend less than 1500 hours at work, so are apparently an example of being satisfied with a slightly lower standard of living. Switzerland would also appear to maintain a reasonable balance between work and play. Japanese live the longest, by some margin even over the Swiss, but are in the bottom half of the table in quality of life and hours worked – their diet is recognised as very healthy, however.
Following is a list of the top 25 countries, for which data is available through the OECD; the first column is a score which identifies the relative quality of life; the second column is the average number of hours worked per year by the population; thirdly, life expectancy should reflect the other two, and although the spread of years is relatively narrow, with just a couple of exceptions, Denmark and Germany surprise a little by their ranking – maybe a little too much beer and a few too many dumplings!? However, the bottom three in each criteria, Belgium, South Korea and Croatia respectively, are all in the bottom six in all criteria.
| # | Country | Score |
Average Hours worked per year |
Years of Life Expectancy |
|---|---|---|---|---|
| 1 | Switzerland | 208.4 | 1576 | 82.5 |
| 2 | Denmark | 206.49 | 1438 | 79.25 |
| 3 | New Zealand | 201.06 | 1752 | 81.05 |
| 4 | Germany | 199.7 | 1363 | 80.57 |
| 5 | Australia | 198.79 | 1663 | 82.15 |
| 6 | Austria | 192.4 | 1629 | 81.39 |
| 7 | Netherlands | 192.4 | 1421 | 81.23 |
| 8 | Norway | 188.9 | 1408 | 81.7 |
| 9 | Spain | 186.41 | 1699 | 81.98 |
| 10 | Sweden | 185.81 | 1607 | 81.98 |
| 11 | Finland | 184.01 | 1643 | 80.77 |
| 12 | USA | 183.96 | 1788 | 79.68 |
| 13 | Portugal | 181.18 | 1852 | 79.16 |
| 14 | UK | 180.25 | 1669 | 80.54 |
| 15 | Canada | 177.23 | 1708 | 81.76 |
| 16 | Japan | 176.06 | 1734 | 84.74 |
| 17 | Slovenia | 175.93 | 1550 | 78.01 |
| 18 | France | 173.56 | 1489 | 81.75 |
| 19 | Croatia | 172.89 | 1665 | 80.68 |
| 20 | Ireland | 171.92 | 1815 | 80.68 |
| 21 | South Korea | 170.29 | 2163 | 80.04 |
| 22 | Czech Republic | 167.38 | 1763 | 78.48 |
| 23 | Israel | 166.63 | 1867 | 82.27 |
| 24 | Greece | 165.33 | 2060 | 80.43 |
| 25 | Belgium | 162.49 | 1576 | 80.88 |


What is Eyal Booker doing now? His Age, Height, Dating, Net Worth
Eyal Booker is a versatile personality known for his roles in reality TV, modeling, and influencing. Recognized for his time...


What does Collete Davis do? Her Age, Height, Leaks, Boyfriend
Collete Davis is known as an American professional race car driver, engineer, entrepreneur, and TV personality. She has competed in...


The Life and Career of Mar De Regil: Age, Height, Parents, Dating
Mar de Regil has become a sensation on social media, especially on her TikTok content account, marderegil, on which she...


Carriejune Anne Bowlby: Story of a Gym Lover and Instagram Star
Carriejune Anne Bowlby was born on 7 February 1996 in New Jersey. She’s known for being a prominent figure in...


The Rise of Susana Almeida: From Weather Girl to Internet Star
Charismatic Mexican weather girl Susana Almeida, found herself thrust into the spotlight of internet fame following an unexpected wardrobe malfunction...


What does Shawn Cee do for a living? His Age, Height, Net Worth
Dynamic American YouTuber Shawn Cee, has successfully carved out a distinctive niche within the music review and reaction space. Boasting...


What does Peter Vigilante do? His Age, Height, Leaks, GF, Net Worth
Peter Vigilante is a multifaceted personality, acclaimed as a social media sensation, personal trainer, and reality television star. His journey...


How did Matt Sturniolo become Famous? His Age, Height, GF, Bio
Matt Sturniolo is a prominent American content creator and social media personality, widely known as one of the Sturniolo triplets....


What is Kennedy Walsh famous for? Her Age, Height, Dating, Salary
Notable social media personality Kennedy Walsh, has garnered widespread acclaim for her engaging content on platforms such as YouTube, Instagram,...


What is Jacob Day Famous for? His Age, Height, Dating, Net Worth
American social media sensation Jacob Day, catapulted into the limelight by sharing an array of lip-sync performances and humorous video...
-


 Rappers9 months ago
Yung Berg Net Worth
-
 Singers1 year ago
Adam Lambert Net Worth
-
 Models9 months ago
Kendra Wilkinson Net Worth
-
 Producers1 month ago
Teddy Riley Net Worth
-
 Lists1 day ago
Where are those from “Yukon Men” today?
-
 Singers4 months ago
Justin Bieber Net Worth
-
 Celebrity Money10 months ago
The 10 Best-Paid Musicians in the World
-
 Rappers1 year ago
Lecrae Net Worth


